Originally published in the Rodale Institute’s Organic Farming Economics Report
https://rodaleinstitute.org/wp-content/uploads/Rodale-Institute-Organic-Farming-Economics-Report.pdf
Transitioning to organic farming is an investment of time, labor, and other resources that may be recouped in a variety of ways. Organic farm products are in greater demand than ever before, and consumers are willing to pay higher prices for them. While the costs of producing organic farm goods may be more than the costs of producing conventional goods, the net revenues for certified organic producers often exceed those of nonorganic operations.
Soaring sales. US organic farm sales have grown from an estimated $609 million in 2002, when the National Organic Program was implemented, to $11 billion in 2021, according to a USDA report published in 2023. 3 While organic acreage was still just 1 percent of US farmland in 2019, sales of organic farm products accounted for almost 3 percent of US farm receipts. “US organic farms continue to have higher production costs than the average of all US farms but also higher average total sales and net cash income,” the report notes.
Growing demand. After adjusting for inflation to 2021 dollars, US retail sales of organic food have risen more than five times since 2002, and in 2023 they reached more than $70 billion. Organic food sales continue to grow at a faster rate than overall food market sales. 4
Expanding markets. Organic farm products are fully in the mainstream. More than 50 percent of organic food sold in 2021 was purchased at conventional grocery retailers, including Walmart and Target. 5
Premium prices. The return on many organic farm products dramatically exceeds that on goods from conventional operations. Organic dairy products are among the most popular categories for consumers in the US, now representing 8 percent of total milk and egg sales. The average retail price in February 2025 for a gallon of organic milk was $4.81 versus $3.49 for conventional, says a report from the USDA’s Agricultural Marketing Service. 6
Demand for organic field crops grown for livestock feed and processed foods keeps their prices higher than those of conventional crops too. Organic corn producers took in 241 percent more per bushel than conventional corn, according to FINBIN data gathered between 2016 and 2020 by the Flanagan State Bank of Illinois, a farm loan institution. 7 Flanagan reported that organic wheat earned a 250 percent premium, organic soybeans a 145 percent premium, and organic hay a 128 percent premium compared with the prices of their conventional counterparts, during the same period. US Census of Agriculture data that includes farm revenues and costs indicates that for most crops, organic farming prices and practices are profitable while conventional ones lead to a net economic loss. (See tables on page 19).
Higher income. Even more important, organic producers are netting higher profits from their crops. The Flanagan reports highlighted that organic corn crops earned 163 percent more income per bushel than conventional crops. Organic wheat generated 182 percent more income per bushel, and organic soybeans 145 percent more, compared with the returns of the conventional crops.
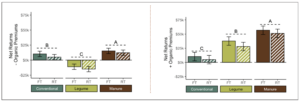
While organic yields are sometimes lower than conventional yields, the loss in production is typically between 9 and 25 percent and the price premiums provided for organic crops result in higher gross revenues despite some production loss. The long-term Farming Systems Trial at Rodale Institute has found comparable yields of corn and wheat between organic and conventional crops while organic soybeans are on average 13 percent lower. 8 The graphs below show that the expenses related to organic farming practices (figure 2) are similar to, or even slightly less, than conventional producers spend. Organic farmers earn a price premium (figure 1) that results in higher profits than those of conventional operations.
Middle step. While farmers must wait three years after they begin the process of transitioning to label their products as organic, USDA-approved certifying agents, such as QAI, are offering farmers a plan that includes “certified transitional” labels. These have several levels, including “contains transitional ingredients.” Products with these labels may not earn the same premium as certified organic products, but it can be enough for some buyers to support a higher cost.
LEARN MORE Flanagan State Bank flanaganstatebank.com/organic NSF: QAI nsf.org/consumer-resources/articles/certified-transitional
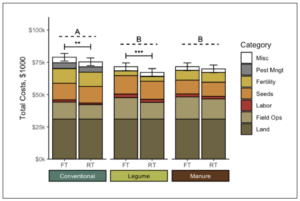
Figure 1 (left): Average annual costs for each representative farm with different tillage x system treatments. Total costs include land (brown), field operations (variable and fixed pre harvest and harvest activities: tan), labor (dotted red), seeds (horizontal yellow lines), fertility inputs (diagonal gold lines), pest management inputs (vertical gray lines), and all other costs (interest, insurance, miscellaneous expenses: white). Error bars are standard errors for total costs within each tillage x system treatment.
Figure 2 (below): Average annual gross revenue and net returns for each representative farm with different tillage x system treatments (from 2008 to 2013, 2016 to 2020). Gross revenue (A) with and (B) without organic premiums, net returns (gross revenue – total costs) (C) with and (D) without organic premiums. Error bars are standard errors.
Different letters indicate significant differences across systems (Tukey HSD, P < 0.05), while asterisks indicate significant differences between tillage treatments within each system (at P < 0.05).
Advertisements